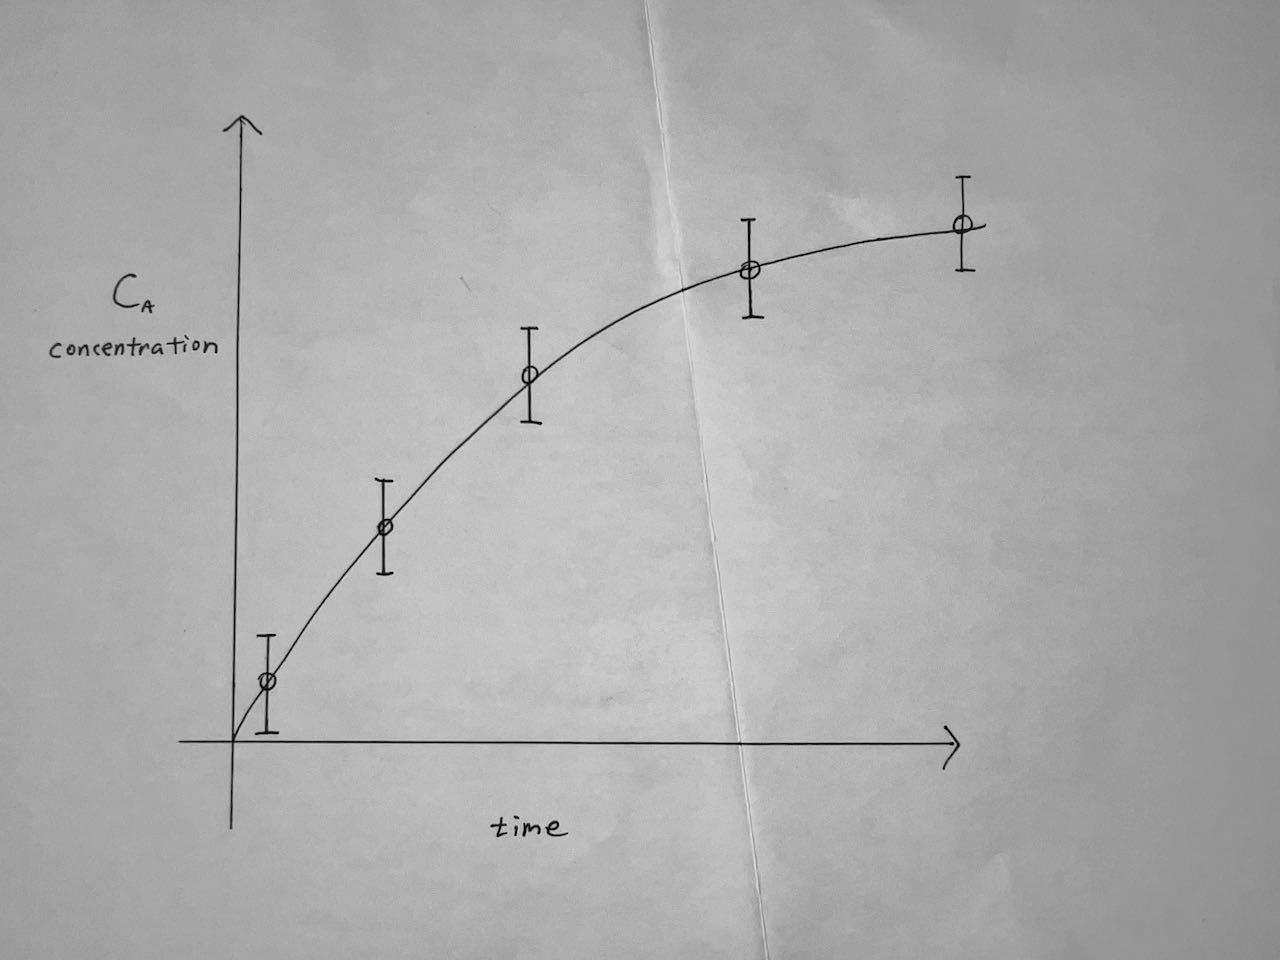
You are an engineer going about your day, when a colleague shows you a new plot of concentration versus time that they made for a chemical reaction under study. You agree to give it a look and offer your feedback.
What question should you ask your colleague regarding this plot?
If you are not already acquainted, you might ask what chemical species is denoted by “A.” You might also ask for more detailed time demarcations than what I contrived for this example in the hand drawing above.
What interested me most was the strikingly similar error bars. Very few processes in practice will display exactly equal variance among data points, and chemical reactions in particular will tend to display greater error early on, when changes are greater; and relatively less error as the reaction reaches completion and there is less dramatic change with time.
It turns out that the experimentalist collected replicates only for a single data point, the fourth time point. The other time points were single experiments. They then assumed equal variance and applied the error bars for the fourth datum to all data. This behavior falls short of best practices. If replicates are only carried out for a single time point, then the honest behavior is to only provide graphical error bars for the datum for which replicates were actually carried out, and to leave the others time points represented by single datum markers.
This behavior also illustrated a potential underlying difference in philosophy about data, replicates, and error. The researcher implicitly believed that they were collecting the average when carrying out single experiments, and that they were collecting the spread of data when carrying out replicate experiments. The truth, however, is that only replicate experiments can provide both a sense of the mean and the standard deviation of the sample.
You need to carry out replicate experiments in order to know the sample average.
Be careful out there. There are lies, damned lies, and statistics.
Leave a Reply