I picked up Chris Guillebeau’s book, “100 Side Hustles.” I’m about a quarter of the way through the book. I was interested in how start-up cost related to revenue based on the type of side hustle.
While reading, I created an excel spreadsheet that summarized the side hustle. I included a title for the idea, start-up costs, revenue for each of the first three years, and a category for the side hustle. Not all the featured side hustles included revenue for the first three years. Some of the side hustles were only a few months old. For seasonal side hustles, I used the seasonal revenue as the annual revenue. For non-seasonal side hustles, I extrapolated to a year. For those side hustles that broke down their cash flow into first, second, and third year revenue, I noticed that year 2 revenue was usually very close to year 3 revenue.
Since I was interested in how input cost related to stable revenue, I decided to plot “Year 1 Cost” vs. “Year 2 Revenue.” If year 2 revenue was not clearly reported, I used the annual revenue.
I categorized the side-hustles myself according to the following categories.
- Hand made
- Education
- Manufacturing
- Shipping
- Freelance
- Resale
- Event planning
I wrote the following python script.
import pandas as pd
import matplotlib.pyplot as plt
import matplotlib as mpl
import seaborn as sns

df = pd.read_excel('100SideHustles.xlsx')

x = df["Y1 Cost"]
y = df["Y2 Revenue"]

ax = sns.scatterplot(df, x=x, y=y, hue = df["Category"])
plt.title("Side Hustle Performance by Category")
plt.xlabel("Start-up cost ($)")
plt.ylabel("Year 2 Revenue ($)")
ax.yaxis.set_major_formatter(mpl.ticker.StrMethodFormatter('{x:,.0f}'))
ax.xaxis.set_major_formatter(mpl.ticker.StrMethodFormatter('{x:,.0f}'))

plt.savefig("SideHustles_00.png")
plt.show()
plt.clf()
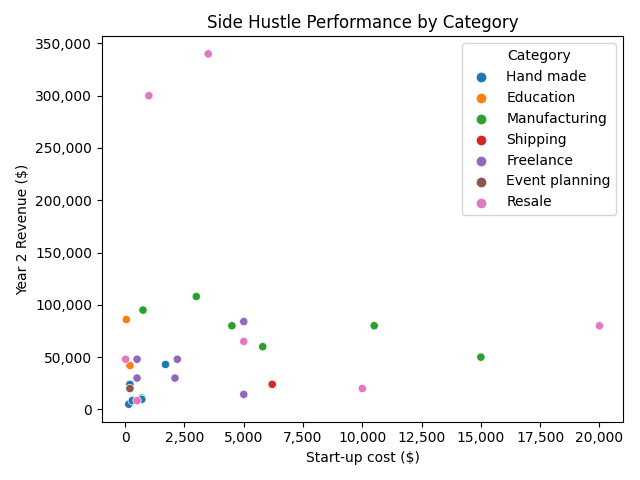
For this small sample size of 29 side hustles, I made the following observations: The two side hustles with the highest revenue were resales. One of the two side hustles with the highest start-up cost was a resale project, and the other was a manufacturing project. Education side hustles had the lowest start-up costs. The handmade side hustles generated $10k to $50K per year. Freelance services generated $20k – $100k per year.
As I continue reading, I will update this plot. I will be curious to see how it evolves.
Leave a Reply